Start with the legend and grading limits
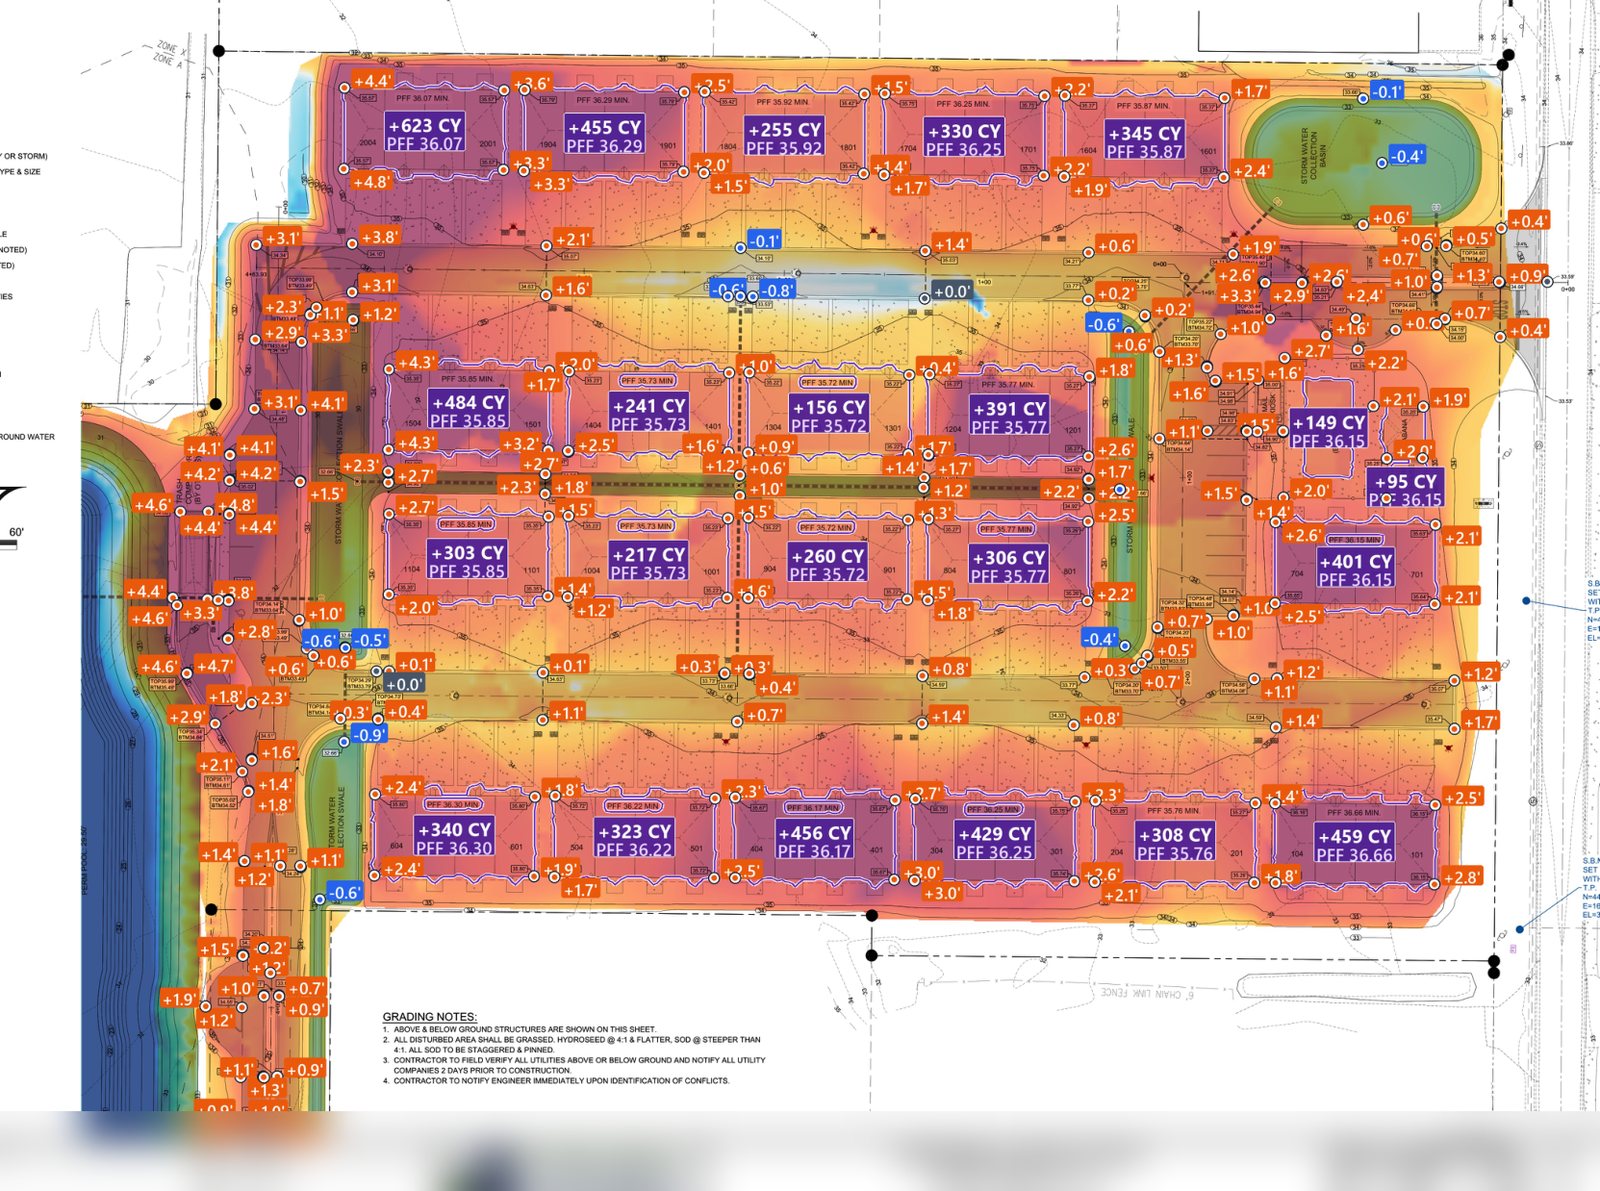
In this Foreman example, blue is cut and orange to red is fill. The shade represents depth. Check the signed spot labels to read a depth in feet. Color schemes vary by tool, so check the legend on the map in front of you. The edge of the overlay shows where the result was calculated.
Start with a spot you can check on the plans. If proposed grade is higher than existing, that point needs fill. If it’s lower, it needs cut. Check that both elevations use the same vertical datum.
Read the pad labels and compare them to the report
A spot label shows the depth at a location. A pad total adds up volume across the area. Check that the proposed surface matches the estimate basis, such as finished grade or subgrade after the paving and pad sections are applied.
Review the deepest cuts, the biggest fills, and transitions at retaining walls, tie-ins or section changes. If a patch looks wrong, check spot elevations, contour interval, boundary and the surface used in the calculation.
Use the report to price dirt movement
Check the separate totals for cut and fill, then apply your material assumptions for shrink, swell, reuse and topsoil. Compare the import or export balance to load capacity and haul conditions. A map shows where to look. The quantities, material assumptions and haul plan set the price.